Reports - Creating a Report from a Revit Schedule
![]() Updated 3 years ago
by
Kerry Poe
Updated 3 years ago
by
Kerry Poe
- Creating a Report from a Revit Schedule
Creating a Report from a Revit Schedule

Summary
One of the easiest ways to create a report is to use an existing Revit Schedule. A benefit of creating a report in this manner is using the Revit Schedule to verify the results. The following references the Cut List schedule in the eVolve Electrical Project Template.

Determining Fields, Filters, and Groupings
- From the Revit Project Browser, expand the Schedules/Quantities section and select the desired schedule. The following instructions refer to the eE_Cut List but may be applied to any schedule.
- With the desired schedule selected, open the Properties Palette.
- From the Properties Palette, in the Other/Fields, click the Edit button.
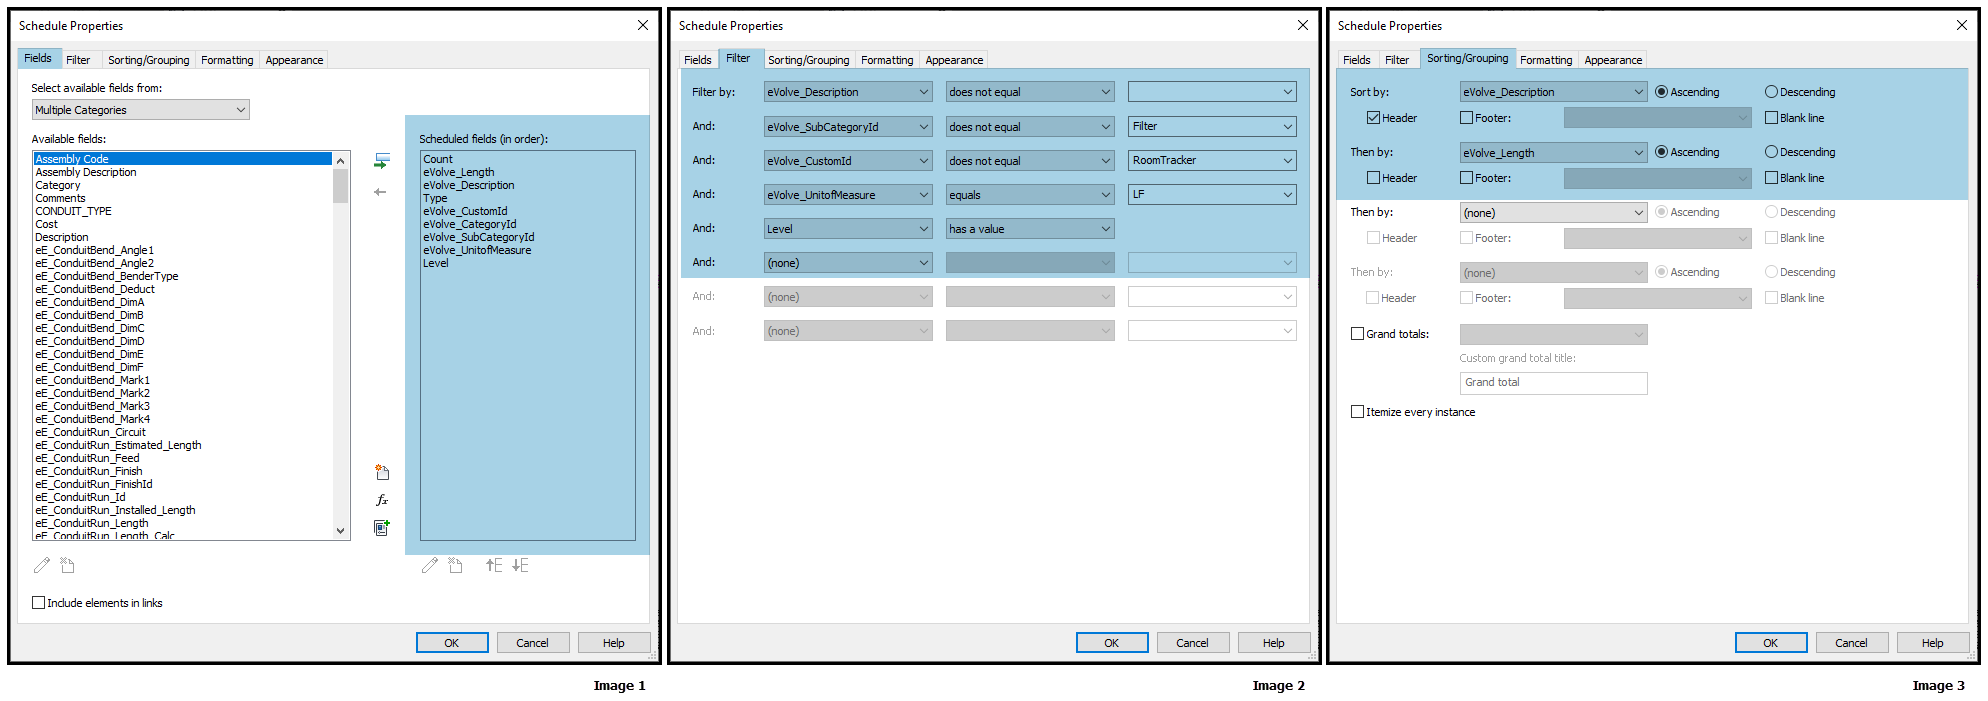
- From the Schedule Properties window, note the following:
- From the Fields tab, all parameters in the Scheduled fields (in order) list.
- From the Filter tab, all displayed conditions.
- From the Sorting/Grouping tab, all parameters and they sort order.
TIP: take a screenshot of each tab to prevent reopening the System Properties window multiple times.

Creating a Data Profile
Creating a Data Profile involves defining categories, selecting parameters, and optionally specifying conditions.
Defining the data profile's categories
- From the eVolve ribbon, in the Utilities panel, click Data Profiles. For this example, we will name the profile MyTestDataProfile.
- From the Data Profiles window, in the Data Profiles grid, in the Name cell, enter a descriptive title to identify the data profile.
- From the Element Filter cell, click the ellipsis button.
- From the Data Profiles (Embedded Filter) window:
- From the Categories panel, select at least one category.
- From the Rules panel, specify the conditions to which all elements must adhere to be selectable in the report. While you can create filters/conditions in the data profile, these instructions will show how to create the filters/conditions in the report designer.
NOTE: Filters/conditions may be specified in the data profile or the report designer. Filtering the data in the data profile may decrease the load time of the report designer, but the selectable data may be limited.
TIP 1: If you want to use the dynamically populated parameters feature, selecting fewer categories will display a more extensive list of available parameters. Selecting multiple categories reduces the parameters displayed in the next step, as only the parameters common to the selected categories are displayed. While a parameter may not be displayed, you can specify the parameter manually. Keep in mind, the parameters are spelling and case-sensitive.
TIP 2: If you are unsure which category or categories to check, from the drawing area, select an element that should appear in the report taking note of its category. Other categories can be added later, but this should get you started. Additionally, from the schedule, select a row and click Highlight in Model from the Modify Schedule/Quantities tab. This option highlights the element(s) in the model. If an active view does not contain the element(s), Revit displays prompts guiding you through opening the view or views that contain the element(s).
Selecting the data profile's parameters
The parameters used in the Revit schedule are the available fields that appear in the report designer and can be found In the Scheduled fields (in order): list on the Fields tab from the Schedule Properties window; see Image 1 above.
WARNING: Use caution when running PowerShell scripts and only do so if necessary. Running PowerShell scripts will increase the load time of a report as each script runs on every element adhering to the data profile's constraints.
- From the Data Profiles (Embedded Filter) window, in the Fields for [Data Profile Name] panel, from the top row (Click Here to add a new row)
- In the Column Name cell, enter a value. This is the field name that will appear in the report designer.
- In the Parameter cell, enter the desired parameter.
- To add a row, click the Apply button -or- column header -or- row header (the white space to the left of the grid).
- Repeat until all desired parameters have been added to the data profile, then click OK.
NOTE: Do not concern yourself with adding Count; it is not a parameter and will be calculated in the report.
TIP 1: all values are stored in imperial decimal feet within the Revit database regardless of the units the project is set. When checked, the Use Display Value checkbox sends the values displayed in Revit as a string to the report designer instead of the value stored in the database. Typically, it is best to send the stored value, then convert it from within the report designer using the To_xyz_Display Revit Function in the Expression Editor.
TIP 2: Some parameters are not readily available and must use other methods like PowerShell to access their values. EVOVLE has added some commonly accessed values to the Special/ITM Values menu. Currently, these parameters include Project Information, Element Id, XYZ Coordinates, and Fabrication Data, but they can be expanded upon in the future.

Creating a report from a template
Copying the template file
- Navigate to C:\Temp\eVolve\eVolve Reports\Report Files\Report Templates or where ever you've extracted the Sample Files.
- Copy the desired .repx file, depending on whether you are creating a portrait or landscape report. For this example, we will choose the portrait template.
- Navigate to C:\Temp\eVolve\eVolve Reports\Report Files or the location your report will reside, like a network location, then paste the copied .repx file, and rename the file to be easily identified in the future. For this example, we will name the file MyTestCutList.repx.

Configuring the report
- From the eVolve ribbon, in the Utilities panel, click Report Manager.
- From the grid, in the top row (Click here to add a new report), enter a value in the Name cell. For this example, we will name the report, My Test Report.
- From the Primary Profile menu, select MyTestDataProfile.
- From the Report File Path, navigate to C:\Temp\eVolve\eVolve Reports\Report Files, select the MyTestCutList.repx file, and click Open. If you have saved the template to a different location, navigate to that location instead.
- While it is not required, specifying a Description, Group, and Sub Group may be helpful when locating the report in the future.
Specifying an alias for the data profile
Assigning an alias to a data profile is especially helpful when working with multiple data profiles/tables, or both. Suppose an alias is not assigned to the data sources. In that case, the Primary Profile displays as eVolveData, the Additional Profiles displays as eVolveSubData1, evolveSubData2, etc., and Data Tables display as eVolveTable1, eVolveTable2, etc. If a Data Profile/Table is renamed, its order may change, breaking all associations in the report. Not only will it help to distinguish between data sets, but it can also prevent refactoring the report if a data source is renamed.
- From the Report Manager window, click the ellipsis button in the Data Relationship cell.
- From the Define Data Relationships window, enter an alias for all data profiles/tables, then click OK. For this example, enter MyTestDataProfile.
NOTE: an alias may only contain letters and numbers; no spaces or special characters are allowed.
- From the Report Manager window, click Apply or OK.
Designing a report
Opening the report Designer
- From the eVolve ribbon, in the Utilities panel, click Report Manager.
- From the grid, select My Test Report, ensuring the checkbox is checked.
- From the tool palette, click Open Report Designer.
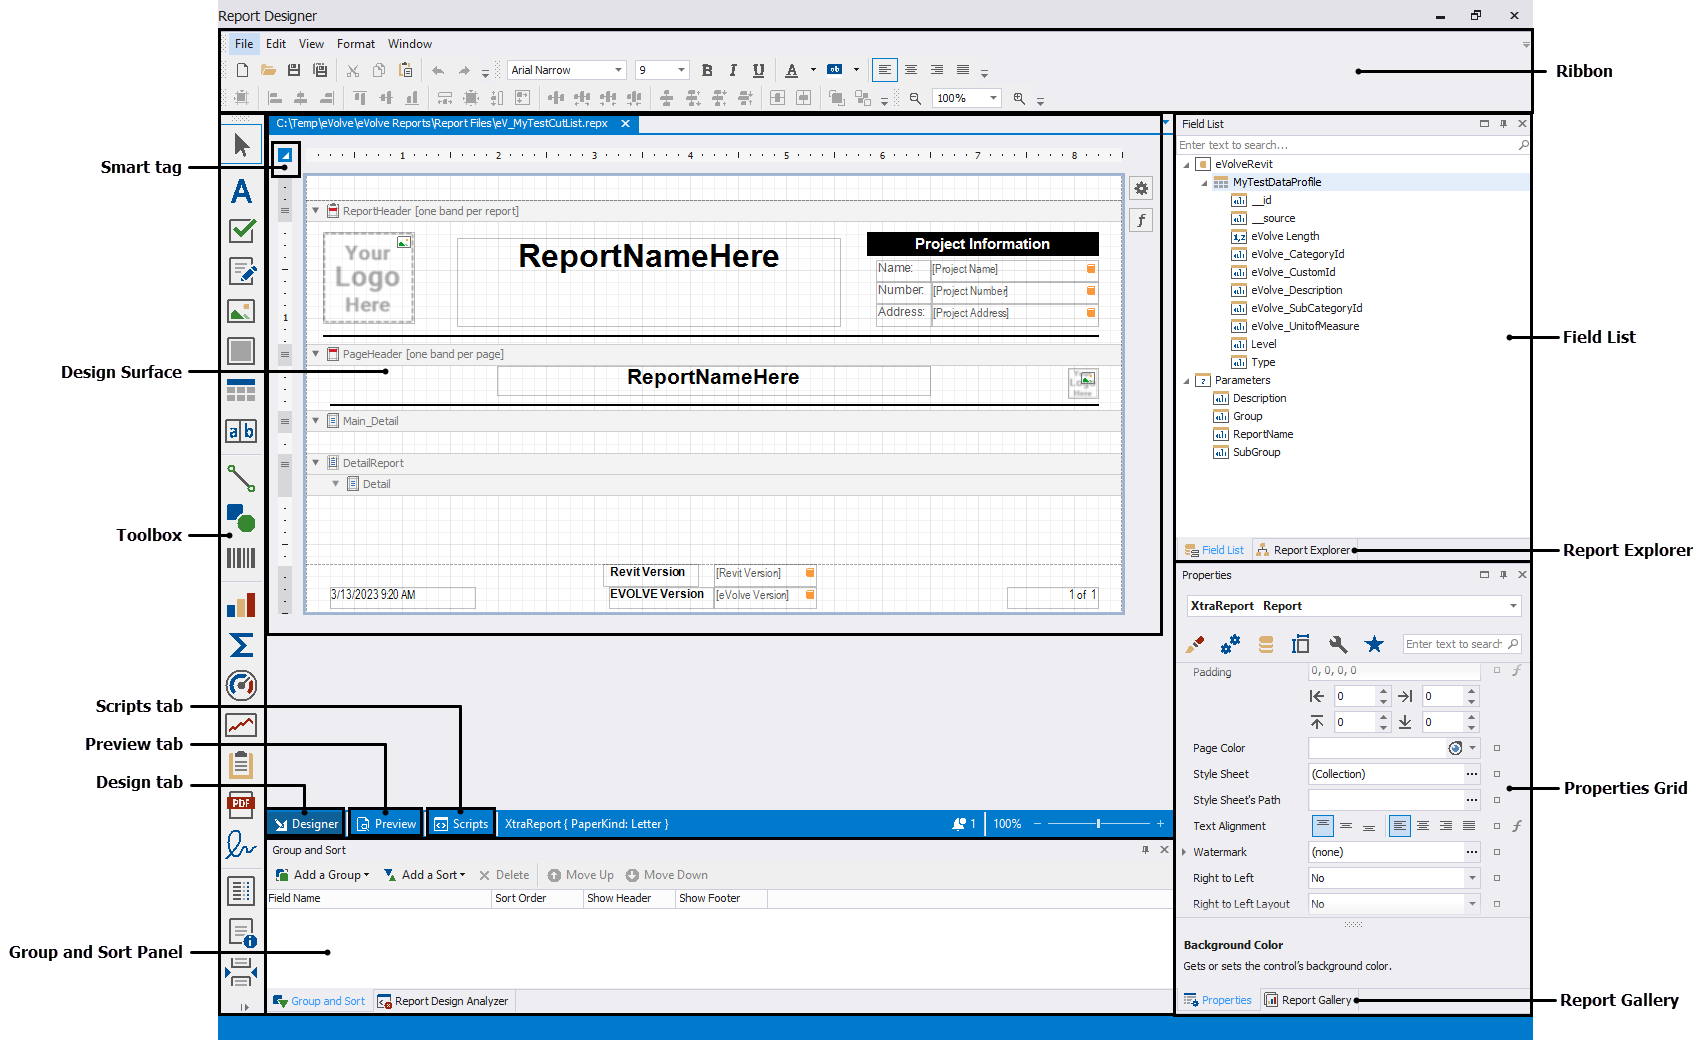
The design surface displays a report's structure and contents. You can use the tools on the Report Designer's panels to design the report:
- access the report's data source schema in the Field List.
- drop report controls from the Toolbox to the design surface.
- use the Ribbon toolbar and Property Grid to set up the report controls.
- access the report's elements in the Report Explorer.
- use the Group and Sort panel to manage the report's group and sort settings.
Specifying Filter/Conditions in the Report
- From the Report Designer window, with the report opened, click the Smart Tag.
- From the Report Tasks popup window, click the Filter String ellipsis.
- From the FilterString Editor window, hover over And, click +, and select Add Condition.

Videos
Overview of the Report Designer
Creating a Report from a Revit Schedule
Adding Report Options
